


The Three Inside Down candlestick pattern is a three-candle bearish reversal pattern that can signal weakening buying pressure after an uptrend. It is formed when a strong bullish candle is followed by a smaller bearish candle whose real body sits inside the first candle’s body, followed by another bearish candle that confirms the downside move.
The first two candles create a structure similar to a Bearish Harami, while the third candle provides additional confirmation that sellers may be taking control.
Because candlestick patterns are based on price action rather than guaranteed future outcomes, the Three Inside Down should be treated as a potential reversal signal rather than a certainty.
What Is the Three Inside Down Candlestick Pattern?
The Three Inside Down is a bearish reversal candlestick pattern that generally appears after an established upward move.
Its three candles tell a simple story:
- Buyers remain in control with a strong bullish candle.
- Buying momentum starts to weaken as a smaller bearish candle forms inside the first candle's body.
- Sellers follow through with another bearish candle, providing confirmation of the potential reversal.
The pattern is essentially a Bearish Harami followed by a bearish confirmation candle. That additional candle is what makes the Three Inside Down different from simply spotting a Bearish Harami.
For a broader introduction to chart-based price patterns, you can also review the types of candlestick patterns available in technical analysis.
How the Three Inside Down Pattern Forms
The pattern develops over three consecutive candles.
Candle 1: Strong Bullish Candle
The first candle is generally a relatively long bullish candle.
It appears while the market is already moving upward and shows that buyers still have control.
For example, if a stock has been rising for several sessions and then prints a large green candle, that candle can become the first part of a Three Inside Down setup.
Candle 2: Smaller Bearish Candle
The second candle is smaller and bearish.
Its real body forms within the real body of the first bullish candle. This creates the Bearish Harami portion of the pattern.
The candle indicates that buyers are no longer pushing price with the same strength as before.
You can learn more about the underlying setup in the article on the Bearish Harami candlestick pattern.
Candle 3: Bearish Confirmation Candle
The third candle is bearish and closes below the second candle's close.
Some stricter interpretations look for the third candle to close below the first candle's open, creating stronger confirmation of the bearish reversal. Different charting references use slightly different confirmation criteria, so traders should define their rules before applying the pattern.
The key idea is that the third candle demonstrates that sellers have followed through rather than the second candle being only a temporary pause.


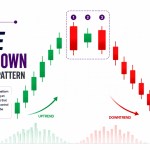
Three Inside Down Candlestick Pattern Example
Imagine a stock has been rising from $50 to $65 over several weeks.
Suppose the following three candles appear:
| Candle | Price Action | What It Suggests |
|---|---|---|
| 1 | Large bullish candle | Buyers remain strong |
| 2 | Small bearish candle inside Candle 1's body | Buying momentum weakens |
| 3 | Bearish candle closes below Candle 2 | Sellers gain control |
The first two candles resemble a Bearish Harami. The third bearish candle adds confirmation.
The pattern does not mean the stock must immediately fall. Instead, it tells traders that the previous bullish momentum may be losing strength and that further confirmation from price action or other analysis may be useful.
What Does the Three Inside Down Pattern Indicate?
The Three Inside Down generally indicates a possible transition from bullish momentum to bearish momentum.
The psychology behind the pattern can be understood in three stages.
Stage 1: Buyers Are in Control
The first bullish candle shows strong demand.
Traders are willing to buy at increasingly higher prices, supporting the existing uptrend.
Stage 2: Buying Pressure Weakens
The smaller bearish second candle shows that the market is no longer moving higher with the same conviction.
Instead of another strong bullish candle, sellers manage to push price lower while remaining within the previous candle's body.
This creates the first warning that the uptrend may be losing momentum.
Stage 3: Sellers Confirm the Shift
The third bearish candle shows stronger follow-through from sellers.
When the third candle moves below the relevant confirmation level, the probability of a bearish reversal may increase compared with the Bearish Harami alone.
This is why the pattern is considered a confirmation-based reversal formation.
How to Identify the Three Inside Down Pattern
When scanning a chart, use the following checklist:
- Look for a meaningful uptrend before the pattern.
- Identify a relatively long bullish first candle.
- Check whether the second candle is smaller and bearish.
- Confirm that the second candle's real body is contained within the first candle's real body.
- Look for a third bearish candle.
- Check that the third candle closes below the second candle's close.
- For a stricter interpretation, check whether the third candle also closes below the first candle's open.
- Look for additional confirmation from the broader chart structure.
The prior trend is important. A similar three-candle shape appearing in a sideways market does not automatically carry the same reversal meaning.



Why the Previous Uptrend Matters
A reversal pattern needs an existing trend to reverse.
If a Three Inside Down-like formation appears in a completely sideways market, there may not be enough bullish momentum to meaningfully reverse.
The setup is more logically interpreted when:
- Price has been rising
- Buyers have controlled the recent trend
- The pattern forms after an extended advance
- Price approaches a resistance area
- Momentum begins to weaken
This context can help separate meaningful reversal setups from random candle combinations.
How Traders Use the Three Inside Down Pattern
There is no single universally correct way to trade a candlestick pattern.
A trader may use Three Inside Down as a signal to:
- Watch for a potential bearish reversal
- Reduce an existing long position
- Wait for additional confirmation
- Look for a short setup where short selling is appropriate
- Combine the pattern with support and resistance
- Evaluate momentum indicators
- Review volume and broader market conditions
The pattern should generally be treated as one piece of technical analysis rather than a standalone trading system.
For example, a bearish reversal signal near an established resistance area may be more meaningful than the same formation appearing randomly in the middle of a strong uptrend.
Confirmation for Three Inside Down
Although the third candle itself provides confirmation within the pattern, some traders may wait for additional evidence before acting.
Possible confirmation factors include:
1. Support Breakdown
A move below a nearby support level can strengthen the bearish case.
2. Volume
Higher trading volume during the bearish move can provide additional evidence that sellers are participating.
However, volume should be interpreted in the context of the specific market and timeframe.
3. Resistance
A Three Inside Down pattern forming near a previous resistance zone may provide a more logical reversal context.
4. Momentum Indicators
Traders may also compare the candlestick pattern with tools such as RSI or MACD.
For example, weakening momentum while price is approaching resistance may support the bearish interpretation.
These tools do not guarantee that the reversal will succeed. They simply provide additional information that can be considered alongside price action.



Stop-Loss and Risk Management
A candlestick pattern does not tell you how much money you should risk on a trade.
Risk management needs to be considered separately.
Depending on the trading strategy, a trader might place a stop-loss above:
- The pattern's recent swing high
- The first candle's high
- A nearby resistance level
The appropriate location depends on the chart structure, volatility, timeframe, and individual trading plan.
A stop that is placed too close to the entry may be triggered by normal market fluctuations, while an excessively wide stop can create an unnecessarily large potential loss.
The important point is to define the risk before entering a trade rather than deciding after the market moves against you.
Three Inside Down vs Bearish Harami
The two patterns are closely related.
| Feature | Three Inside Down | Bearish Harami |
|---|---|---|
| Candles | 3 | 2 |
| Typical context | After an uptrend | After an uptrend |
| First candle | Bullish and relatively large | Bullish and relatively large |
| Second candle | Smaller bearish candle inside first | Smaller candle inside first |
| Confirmation | Third bearish candle | No third candle required |
| Signal type | Bearish reversal confirmation | Potential bearish reversal |
The major difference is the additional confirmation candle.
The first two candles of Three Inside Down form the basic Bearish Harami structure, while the third candle demonstrates bearish follow-through.
Three Inside Down vs Three Outside Down
Three Inside Down and Three Outside Down are both bearish reversal patterns, but their candle structures are different.
Three Inside Down begins with a large bullish candle, followed by a smaller bearish candle contained within it, and then a bearish confirmation candle.
Three Outside Down uses a different structure in which the first two candles form a Bearish Engulfing pattern, followed by bearish confirmation.
If you want to compare the latter setup, see the Three Outside Down candlestick pattern.
You can also review the Bearish Engulfing candlestick pattern to understand the two-candle structure behind Three Outside Down.
Three Inside Down vs Three Black Crows
The patterns can look similar because both can appear during a potential shift toward bearish momentum, but their structures are different.
Three Inside Down starts with a bullish candle and then transitions through a Bearish Harami structure before the bearish confirmation candle.
Three Black Crows, by contrast, consists of a sequence of bearish candles and is generally associated with sustained selling pressure rather than the same harami-based reversal structure.
For another multi-candle bearish setup, see the Three Black Crows candlestick pattern.
Advantages of the Three Inside Down Pattern
It Has Built-In Confirmation
Compared with a standalone Bearish Harami, the third candle provides additional evidence that sellers are following through.
It Is Relatively Easy to Recognize
The three-candle structure gives traders a straightforward visual framework.
It Combines Context and Price Action
The pattern considers both the preceding bullish trend and the subsequent shift in candle behavior.
It Can Be Used With Other Analysis
Traders can combine it with support and resistance, volume, momentum indicators, and broader market structure.
Limitations of the Three Inside Down Pattern
The pattern has several important limitations.
It Does Not Guarantee a Reversal
A bearish candlestick formation can fail, particularly when the broader trend remains strongly bullish.
Context Matters
The same three-candle structure may have little significance if it forms in a choppy or sideways market.
False Signals Can Occur
Short-term price movements can create patterns that appear convincing but do not lead to sustained downside movement.
Confirmation Can Reduce Entry Timing
Waiting for additional confirmation may provide more confidence but can also mean entering after part of the price move has already occurred.
It Should Not Be Used Alone
Technical patterns are more useful when considered alongside broader market conditions and a defined risk-management approach.
Common Mistakes When Reading Three Inside Down
Mistake 1: Ignoring the Uptrend
A Three Inside Down pattern is generally interpreted as a reversal setup after an upward move.
Do not label every three-candle formation as Three Inside Down simply because the candle shapes appear similar.
Mistake 2: Treating the Bearish Harami as the Complete Pattern
The first two candles create the Bearish Harami portion.
The third candle is important because it provides the bearish confirmation associated with the Three Inside Down pattern.
Mistake 3: Entering Without Considering Risk
Even a technically valid pattern can fail.
Decide how much risk is acceptable before taking a position.
Mistake 4: Ignoring Support and Resistance
A bearish pattern near a meaningful resistance area can have a different context from the same pattern appearing in the middle of an established bullish move.
Mistake 5: Assuming Every Confirmation Is Equally Strong
Different traders and charting systems may define the exact confirmation condition differently.
For example, some references require the third candle to close below the second candle's close, while stricter interpretations look for a close below the first candle's open or low.
Is the Three Inside Down Pattern Bullish or Bearish?
The Three Inside Down is a bearish candlestick pattern.
It is generally used to identify a possible bearish reversal after an uptrend.
The first candle is bullish, but the overall three-candle structure shows a transition from buying pressure toward selling pressure.
Is Three Inside Down a Reversal Pattern?
Yes. It is generally classified as a bearish reversal pattern.
However, "reversal pattern" does not mean the price will definitely reverse. It means the formation can provide evidence that the existing bullish trend is weakening and may transition into a decline.
Is Three Inside Down Reliable?
Its reliability depends heavily on context.
A pattern that forms after a meaningful uptrend, near resistance, with supporting price action may be more useful than the same formation appearing in a random sideways market.
No candlestick pattern should be treated as a guaranteed predictor of future prices.
Using additional confirmation and predefined risk management can help traders avoid relying on the pattern in isolation.
Can Three Inside Down Be Used for Intraday Trading?
Yes, traders can identify candlestick patterns on intraday charts, but shorter timeframes can contain more market noise and false signals.
The pattern should therefore be evaluated alongside:
- Trading volume
- Market trend
- Support and resistance
- Timeframe
- Volatility
- Broader market conditions
A setup on a five-minute chart should not automatically be treated as equivalent to the same structure on a daily chart.
What Happens After a Three Inside Down Pattern?
If the bearish reversal is successful, price may continue lower after the third candle.
However, price can also:
- Move sideways
- Retest resistance
- Produce a false breakdown
- Resume the previous uptrend
- Reverse only temporarily
That is why the pattern should be viewed as a signal to evaluate market conditions rather than a guaranteed forecast.
Frequently Asked Questions
What is the Three Inside Down candlestick pattern?
The Three Inside Down is a three-candle bearish reversal pattern that typically forms after an uptrend. It consists of a strong bullish candle, a smaller bearish candle inside the first candle's body, and a third bearish candle that confirms downside pressure.
What does Three Inside Down indicate?
It indicates that bullish momentum may be weakening and that sellers may be gaining control. The pattern can therefore signal a potential bearish reversal.
Is Three Inside Down the same as Bearish Harami?
No. The first two candles form a Bearish Harami, but Three Inside Down adds a third bearish confirmation candle.
Is Three Inside Down bullish or bearish?
It is bearish. It is generally interpreted as a potential reversal from an uptrend to a downward move.
Does Three Inside Down always work?
No. Like other candlestick patterns, it can produce false signals. Market context, trend strength, support and resistance, volume, and broader price action can affect the outcome.
What confirms a Three Inside Down pattern?
The third bearish candle provides the primary confirmation within the pattern. Depending on the methodology, traders may look for a close below the second candle's close, while stricter definitions may require a close below the first candle's open or low.
How is Three Inside Down different from Three Outside Down?
Three Inside Down begins with a Bearish Harami structure. Three Outside Down begins with a Bearish Engulfing structure. Both are three-candle bearish reversal formations, but their candle relationships are different.
Should beginners trade Three Inside Down?
Beginners should first learn how to identify the pattern and understand its limitations before using it in live trading. A candlestick pattern should be combined with a broader trading plan and appropriate risk management rather than used as a standalone signal.
Final Thoughts
The Three Inside Down candlestick pattern provides a structured way to identify a possible shift from bullish to bearish momentum.
Its strength comes from the sequence:
Strong buying → weakening momentum → bearish confirmation
The first two candles create a Bearish Harami-style setup, while the third candle provides follow-through that can make the reversal signal more meaningful.
Still, the pattern is not a guarantee that price will decline. The preceding trend, chart structure, support and resistance, volume, timeframe, and overall market conditions all matter.
For traders building their candlestick knowledge, it is useful to study Three Inside Down alongside related formations such as Tweezer Top, Evening Star, and Dark Cloud Cover. Looking at these patterns together makes it easier to understand how different bearish reversal structures communicate changes in market sentiment.


2 thoughts on “Three Inside Down Candlestick Pattern: How to Trade This Powerful Reversal Signal”