

The Rising Three Methods candlestick pattern is a bullish continuation pattern that appears during an existing uptrend. It shows a strong upward move, a short and controlled pullback, and then another bullish move that attempts to resume the trend.
The classic pattern contains five candles: one long bullish candle, three smaller candles that consolidate within the first candle’s range, and a final strong bullish candle. The fifth candle closes above the first candle’s close, showing that buyers have regained control.
Unlike a reversal pattern, the Rising Three Methods does not attempt to identify the beginning of a new uptrend. Instead, it helps traders recognize a potential pause within an existing bullish trend.
If you’re new to candlestick analysis, it can help to first understand the broader family of candlestick patterns before studying individual formations.
.candlestick-dropdown { margin: 25px 0; padding: 18px 20px; background: #F7F9FC; border: 1px solid #DCE5F0; border-radius: 10px; font-family: inherit; } .candlestick-dropdown label { display: block; margin-bottom: 9px; font-size: 16px; font-weight: 600; color: #34495E; } .candlestick-dropdown select { width: 100%; max-width: 700px; padding: 13px 16px; font-size: 16px; line-height: 1.5; color: #34495E; background-color: #FFFFFF; border: 1px solid #B8C9DD; border-radius: 7px; cursor: pointer; outline: none; appearance: auto; transition: all 0.2s ease; } .candlestick-dropdown select:hover { border-color: #8FAFD0; background-color: #FBFCFE; } .candlestick-dropdown select:focus { border-color: #8FAFD0; box-shadow: 0 0 0 3px rgba(143, 175, 208, 0.18); } .candlestick-dropdown select option { color: #34495E; background: #FFFFFF; } @media (max-width: 600px) { .candlestick-dropdown { margin: 20px 0; padding: 15px; } .candlestick-dropdown label { font-size: 15px; } .candlestick-dropdown select { width: 100%; padding: 12px 14px; font-size: 15px; } } .candlestick-dropdown { background: #f8fafc; border: 1px solid #e2e8f0; border-radius: 10px; padding: 18px 20px; margin: 25px 0; } .candlestick-dropdown label { display: block; font-size: 17px; font-weight: 600; color: #334155; margin-bottom: 10px; } .candlestick-dropdown select { width: 100%; padding: 12px 14px; font-size: 15px; color: #334155; background-color: #ffffff; border: 1px solid #cbd5e1; border-radius: 7px; cursor: pointer; outline: none; transition: border-color 0.2s ease, box-shadow 0.2s ease; } .candlestick-dropdown select:hover { border-color: #94a3b8; } .candlestick-dropdown select:focus { border-color: #94a3b8; box-shadow: 0 0 0 3px rgba(148, 163, 184, 0.15); } .candlestick-dropdown option { background: #ffffff; color: #334155; padding: 10px; }What Is the Rising Three Methods Candlestick Pattern?
The Rising Three Methods is a five-candle bullish continuation pattern.
It generally forms like this:
- A long bullish candle appears during an existing uptrend.
- Three smaller candles follow and move modestly lower or consolidate.
- These three candles remain within the trading range of the first large candle.
- A final long bullish candle appears.
- The fifth candle closes above the close of the first candle.
The pattern suggests that sellers were able to create a temporary pullback but were not strong enough to overturn the broader bullish trend. Buyers then returned and pushed price higher.
Trading platforms such as thinkorswim and TradingView similarly define the formation as a five-candle bullish continuation structure with three smaller candles contained within the first candle’s range and a final bullish candle closing above the first candle’s close.
For a broader introduction to candle formations, see this guide to types of candlestick patterns.
What Does the Rising Three Methods Pattern Look Like?
The traditional structure is:
Long bullish candle → small pullback candle → small pullback candle → small pullback candle → long bullish candle
A simplified representation looks like this:
🟩 → 🟥 → 🟥 → 🟥 → 🟩
The first and fifth candles are the important bullish candles. The three candles in the middle represent a temporary pause or pullback.
The middle candles should remain contained within the range of the first candle. This containment is one of the features that separates the pattern from an ordinary three-day decline during an uptrend.
The final bullish candle provides evidence that the previous uptrend may be resuming.

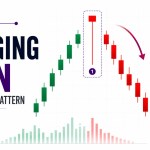

The Five Candles Explained
1. First Candle: Long Bullish Candle
The formation starts with a relatively long bullish candle.
This candle shows that buyers have strong control and pushes the existing uptrend forward.
The candle should have a noticeably larger real body compared with the surrounding candles. It establishes the trading range within which the next three candles are expected to develop.
2. Second Candle: Small Pullback Candle
The second candle is smaller and generally moves against the prevailing trend.
In a classic Rising Three Methods pattern, this is usually a bearish candle.
However, the key point is not simply that the candle is red. Its size and position relative to the first candle matter.
3. Third Candle: Another Small Candle
The third candle continues the short-term consolidation.
It may move slightly lower, but it should remain within the first candle’s trading range.
This indicates that sellers are applying some pressure, but they have not significantly damaged the broader bullish structure.
4. Fourth Candle: Final Pullback Candle
The fourth candle completes the short-term consolidation.
Ideally, it remains small and contained within the range of the first candle.
At this stage, the pattern is not yet confirmed. Traders generally need to wait for the fifth candle before deciding whether the bullish trend is actually resuming.
5. Fifth Candle: Strong Bullish Confirmation
The fifth candle is another relatively long bullish candle.
It signals renewed buying pressure and should close above the close of the first candle.
Some technical-analysis descriptions use the fifth candle closing above the first candle’s high as a stronger visual confirmation. The precise detection rules can vary between charting systems, so traders should understand the criteria used by their platform.
The important idea is that the final candle decisively moves price upward after the controlled pullback.
How the Rising Three Methods Works
The pattern can be understood as a battle between buyers and sellers.
The first large bullish candle shows strong buying pressure.
After that move, some traders may take profits while short-term sellers enter the market. This produces the three smaller candles.
However, the pullback remains relatively controlled. Price does not break down through the entire range created by the first bullish candle.
When the fifth bullish candle appears, buyers regain momentum and push the price upward again.
In simple terms:
Strong buying → temporary profit-taking or selling → controlled consolidation → buyers regain control → potential trend continuation
This is why the Rising Three Methods is classified as a continuation pattern rather than a reversal pattern.
How to Identify the Rising Three Methods on a Chart
Before considering a setup, check the following conditions:
Step 1: Look for an Existing Uptrend
The pattern should appear within an established bullish trend.
Look for evidence such as:
- Higher highs
- Higher lows
- Sustained upward price movement
- A rising moving average
- A generally bullish market structure
Without an existing uptrend, the pattern loses much of its meaning as a continuation setup.
Step 2: Find the Long Bullish Candle
The first candle should be relatively large and bullish.
It establishes the initial bullish momentum and the range that contains the subsequent consolidation.
Step 3: Check the Three Middle Candles
The next three candles should be smaller.
They generally move lower or consolidate, but should remain within the trading range of the first candle.
If the middle candles become very large or price breaks substantially outside the first candle’s range, the setup may no longer resemble the classic pattern.
Step 4: Wait for the Final Bullish Candle
Do not treat the pattern as confirmed simply because the first four candles look correct.
The fifth candle is important because it shows whether buyers actually regain control.
Waiting for the candle to close can help avoid acting on an incomplete pattern.
Step 5: Consider the Broader Chart
A candlestick formation should not be evaluated in isolation.
Consider:
- Trend direction
- Support and resistance
- Volume
- Market volatility
- Higher-timeframe structure
- Recent price action
Candlestick patterns can provide useful information, but they do not guarantee what price will do next.
✨ More Stories for You

 Doji Candlestick Pattern: Meaning, Types & How to Trade">

Rising Three Methods Confirmation
The fifth candle is the primary confirmation element of the classic pattern.
Additional factors can help traders judge whether the setup has meaningful context.
Stronger Trend Structure
A pattern forming inside a clear sequence of higher highs and higher lows generally provides more useful context than the same formation inside a sideways market.
Strong Final Candle
A decisive bullish fifth candle provides stronger evidence of renewed buying pressure than a small or indecisive candle.
Volume Confirmation
Some traders look for stronger volume when the bullish move resumes.
The logic is straightforward: if price breaks higher while participation also increases, the move may have more support than a breakout occurring on weak activity.
However, volume is not a guarantee of continuation.
Supportive Higher-Timeframe Trend
A Rising Three Methods formation on a daily chart may carry different implications from one appearing on a very short intraday chart.
Looking at a higher timeframe can help determine whether the broader trend is actually bullish.
How Traders May Use the Rising Three Methods
The pattern is primarily used as a trend-continuation signal.
A trader may first identify an existing uptrend and then wait for the five-candle structure to form.
After the fifth candle confirms the bullish continuation structure, the trader may evaluate whether the setup fits their broader trading strategy.
Possible considerations include:
- Entry after confirmation
- Support from the previous consolidation area
- A predefined stop-loss level
- A potential profit target
- Risk-to-reward considerations
- Overall market conditions
The exact entry and exit rules should come from the trader’s strategy rather than from the candlestick pattern alone.
A candlestick pattern cannot eliminate market risk.
Where Could a Stop-Loss Be Considered?
There is no single universally correct stop-loss level for the Rising Three Methods.
A trader might consider a level below a meaningful support area or below the structure that would invalidate the bullish setup.
For example, if price breaks decisively below the consolidation structure and the pattern no longer behaves like a bullish continuation setup, that could be considered a sign that the original thesis needs to be reassessed.
Stop-loss placement should account for:
- Price volatility
- Support levels
- Position size
- Trading timeframe
- Risk tolerance
- Overall strategy
The important principle is to define the risk before entering rather than deciding after the trade starts moving against you.
For readers learning broader risk controls, the guide on how to set a stop-loss provides useful background.



Rising Three Methods vs. Falling Three Methods
The Rising Three Methods and Falling Three Methods are essentially bullish and bearish counterparts.
| Feature | Rising Three Methods | Falling Three Methods |
|---|---|---|
| Trend | Uptrend | Downtrend |
| Pattern Type | Bullish continuation | Bearish continuation |
| First Candle | Long bullish | Long bearish |
| Middle Candles | Small pullback/consolidation | Small upward consolidation |
| Final Candle | Long bullish | Long bearish |
| Expected Direction | Continuation higher | Continuation lower |
The Rising Three Methods occurs during an uptrend, while the Falling Three Methods candlestick pattern is associated with a downtrend.
Understanding both patterns can make it easier to recognize how candlestick continuation formations work in opposite market environments.
Rising Three Methods vs. Three White Soldiers
These two patterns can look bullish, but they tell different stories.
Three White Soldiers consists of three consecutive strong bullish candles and is generally associated with sustained buying pressure.
The Rising Three Methods contains a clear pause or pullback between two strong bullish candles.
| Feature | Rising Three Methods | Three White Soldiers |
|---|---|---|
| Main Type | Continuation | Bullish reversal/continuation context |
| Candles | Five | Three |
| Structure | Bullish candle + pullback + bullish candle | Three strong bullish candles |
| Pullback | Yes | No major pullback |
| Main Message | Trend pauses and resumes | Strong buying momentum |
You can learn more about the three-candle bullish formation in the Three White Soldiers candlestick pattern guide.
Rising Three Methods vs. Bullish Engulfing
The Bullish Engulfing pattern is another bullish candlestick formation, but it has a different structure.
A Bullish Engulfing pattern typically involves two candles, with a bullish candle whose body engulfs the previous bearish candle’s body.
Rising Three Methods is a five-candle continuation formation that specifically involves a controlled pullback inside an existing uptrend.
For comparison, see the Bullish Engulfing candlestick pattern.
Rising Three Methods vs. Harami
A Harami is also based on a smaller candle appearing within the body of a larger preceding candle, but its structure and interpretation are different.
The Rising Three Methods requires a broader five-candle sequence and an existing uptrend.
The Harami candlestick pattern can therefore be useful as a comparison when learning how different multi-candle formations are constructed.
Common Mistakes When Reading the Pattern
Mistake 1: Looking for the Pattern Without an Uptrend
A five-candle structure does not automatically become a Rising Three Methods pattern.
The surrounding trend matters.
Mistake 2: Ignoring the First Candle’s Range
The three middle candles are expected to remain contained within the first candle’s trading range in the classic formation.
A large breakdown can weaken the setup.
Mistake 3: Entering Before Confirmation
The first four candles do not prove that the trend will continue.
The fifth candle provides the key continuation signal.
Mistake 4: Treating It as a Guaranteed Buy Signal
The Rising Three Methods is a technical-analysis pattern, not a guarantee of future price movement.
Even well-formed patterns can fail.
Mistake 5: Ignoring Support and Resistance
A bullish continuation pattern appearing directly beneath a major resistance area may behave differently from one breaking through a well-established resistance level.
Context matters.
Mistake 6: Using Too Many Indicators
Adding multiple indicators does not automatically make a trade more reliable.
The goal should be confirmation, not indicator overload.
Limitations of the Rising Three Methods Pattern
The pattern has several limitations.
It Can Produce False Signals
Markets do not always follow historical chart patterns. A bullish continuation setup can fail and turn into a deeper pullback or reversal.
Pattern Identification Can Be Subjective
Different charting platforms may use slightly different rules for candle size, trend detection, and pattern recognition.
For example, TradingView allows different trend-detection approaches when identifying the pattern automatically.
It Works Best With Context
The formation has less meaning when the broader market is choppy or directionless.
It Does Not Predict the Exact Price Target
The pattern can suggest potential continuation, but it does not automatically tell traders how far price will rise.
Any target should come from a separate risk-management or technical-analysis framework.
Historical Pattern Performance Is Not a Guarantee
Research on candlestick patterns can provide useful historical context, but historical behavior should not be interpreted as a promise of future performance. Academic and market-analysis resources have studied the Rising Three Methods as a continuation formation, including work by Thomas Bulkowski.
Is the Rising Three Methods Pattern Bullish?
Yes. The Rising Three Methods is generally classified as a bullish continuation pattern.
It is bullish because the formation occurs within an existing uptrend and ends with a strong bullish candle that indicates renewed buying pressure.
However, bullish does not mean guaranteed.
The pattern should be evaluated alongside trend structure, price levels, volume, volatility, and a defined risk-management plan.
Is Rising Three Methods a Reversal Pattern?
No.
The Rising Three Methods is primarily a continuation pattern.
Its purpose is to show that an existing uptrend may resume after a temporary consolidation or pullback.
This is different from reversal patterns, which attempt to identify a potential change from one market direction to another.
How Reliable Is the Rising Three Methods Pattern?
Its reliability depends on the surrounding market conditions, how strictly the pattern is identified, and what confirmation is used.
A clean pattern within a strong uptrend may provide more useful information than a similar-looking formation inside a sideways market.
It should not be used as a standalone reason to enter a trade.
Technical-analysis resources generally emphasize combining candlestick patterns with other forms of analysis rather than treating the candle formation as a guaranteed forecast.
Frequently Asked Questions
What does the Rising Three Methods candlestick pattern mean?
The Rising Three Methods indicates a potential continuation of an existing uptrend after a brief and controlled pullback. It consists of a strong bullish candle, three smaller consolidation candles, and another strong bullish candle.
How many candles are in the Rising Three Methods pattern?
The classic pattern contains five candles: two relatively long bullish candles separated by three smaller candles.
Is Rising Three Methods bullish or bearish?
It is a bullish continuation pattern because it appears in an uptrend and suggests that buyers may regain control after a temporary pause.
Can the middle candles be bullish?
The traditional version usually has three small bearish candles, but real-world chart formations can vary. The more important characteristics are their relatively small size, controlled pullback, and containment within the first candle’s range.
What confirms the Rising Three Methods pattern?
The fifth bullish candle provides the main confirmation. In the classic structure, it closes above the first candle’s close. Some technical-analysis systems use additional conditions, such as the fifth candle breaking above the first candle’s high.
Is Rising Three Methods good for day trading?
It can be observed on intraday charts, but the pattern should not automatically be considered more reliable because it appears on a shorter timeframe. Traders should consider liquidity, volatility, spreads, market conditions, and their own risk-management rules.
What is the opposite of Rising Three Methods?
The bearish counterpart is the Falling Three Methods, which forms during a downtrend and indicates potential continuation of bearish momentum.
Should you buy when Rising Three Methods appears?
The pattern alone should not be treated as an automatic buy signal. Traders should consider the broader trend, confirmation, support and resistance, volume, risk-to-reward, and their overall strategy before making a decision.
Final Takeaway
The Rising Three Methods candlestick pattern represents a temporary pause within an existing uptrend.
Its classic five-candle structure consists of:
Long bullish candle → three smaller pullback candles → long bullish candle
The key idea is that sellers create a short-term pullback but fail to break the broader bullish structure. The final bullish candle then shows renewed buying pressure.
The most important lesson is not simply memorizing the five candles. The pattern becomes more meaningful when it appears in the right trend context, satisfies its structural conditions, and is supported by sensible confirmation and risk management.
Candlestick patterns are tools for interpreting price action, not guarantees of what the market will do next. Use them as one part of a broader trading process rather than as standalone predictions.


7 thoughts on “Rising Three Methods Candlestick Pattern: Meaning, Structure and How It Works”